NUS Gym Tracker
NUS shows how full its gyms are right now, but keeps no history. I wrote a Telegram bot that tells you how busy the gyms are and saves a reading every 5 minutes, so there will eventually be enough data to say when they're usually quiet.
Sep 2026 – ongoing · Live, collecting since 18 September
| University Sports Centre | 109 / 110 | |
|---|---|---|
| University Town | 0 / 120 |
Why I built it
The REBOKS capacity page shows how many people are in each NUS gym right now. It doesn't show anything else, so you can't tell whether 7pm is always this bad or whether 9pm is quieter. On that Wednesday evening the University Sports Centre gym was at 109 out of 110, which is worth knowing before you walk over.
Other students ask the same things on r/nus.

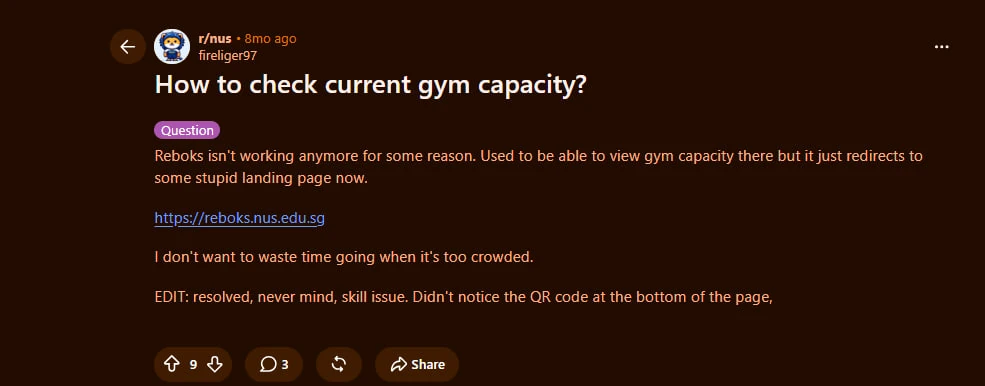
Checking also means opening one app, getting redirected to another and reading a page. A Telegram message is quicker, but the history is the main reason I built it. It tracks the University Town and University Sports Centre gyms. REBOKS also lists two pools, which the parser understands but I don't store.
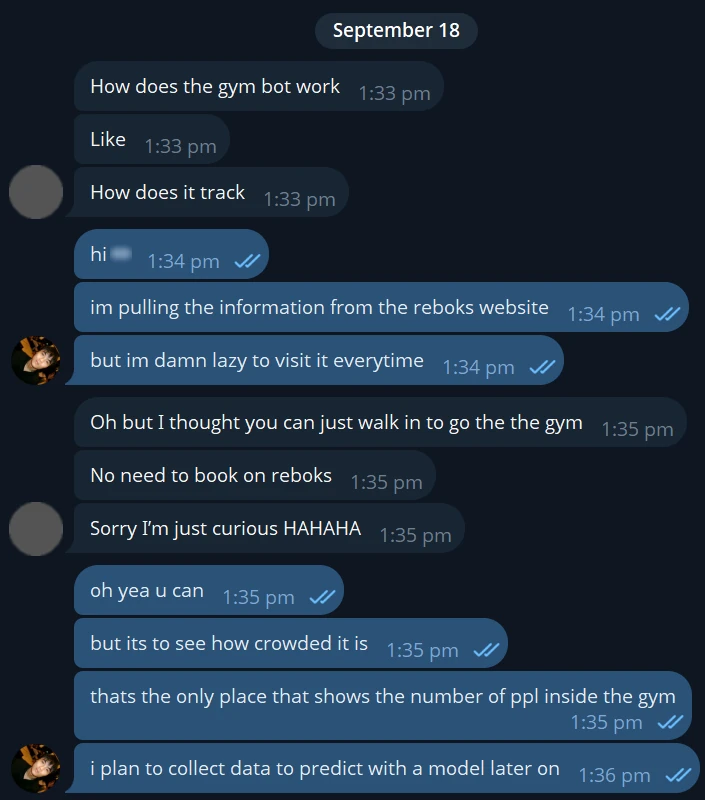
Looking at the data source first
Before writing any of the bot, I spent a whole stage working out how that one page behaves, using a small Python script.
It needs no login. A plain request with no cookies returns the numbers already written into the HTML, so there's no session handling and no headless browser.
The page's JavaScript refers to a JSON endpoint for the gym numbers, but every version of that URL I tried returned 404. A path I made up as a control returned exactly the same response, byte for byte, so as far as the server is concerned the endpoint doesn't exist. The page's own auto-refresh is broken too, because it builds its URL from an element that isn't on the page.
That left parsing the HTML. I used a regex, which I'd normally avoid, but here each facility is one identical machine-generated line with nothing nested inside it. If nothing matches, the parser throws an error instead of returning an empty list, because an empty list would look the same as every gym being empty.
The page is there for students to look at, so the bot makes one request every 5 minutes, with an honest User-Agent and no aggressive retries.
How it works
There are two loops sharing one Cloudflare Worker and one database.
Collecting, every 5 minutes
- Cron trigger
- Worker
- Fetch the REBOKS page
- Parse
- Save to D1
Answering, when someone asks
- /gym on Telegram
- Webhook
- Worker
- Read from D1
- Reply
The bot answers /gym with both gyms right now, and /history with today's readings as a small bar chart. It's written in TypeScript and costs nothing to run: Cloudflare's free tier covers it with about 250 times the headroom it needs. There are 58 tests, including the parser against a real saved copy of the page.
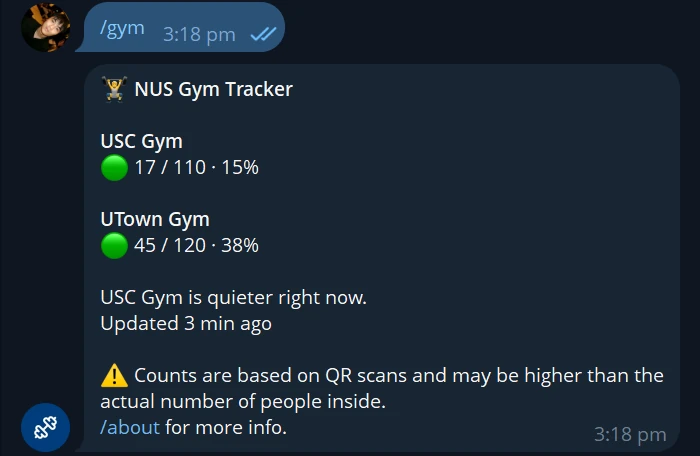
/gym, with the warning about QR scans at the bottom.Decisions
Answering from the database
The bot never scrapes when someone asks. It reads the latest saved row, so NUS gets the same 12 requests an hour however many people use it, and replies are instant.
Webhooks for Telegram
Long polling needs a process running all the time. Webhooks let the whole thing run serverless.
Saving when I collected it
The page's "last updated" time is just when the page was rendered, and cron triggers don't fire exactly on time. The collection time is the only honest timestamp. It's stored in UTC and converted to Singapore time for display.
Saving the capacity every time
Capacity seems to change, so it's stored with each reading instead of once per gym.
No prediction yet
The limit here is how many weeks of data there are. A week has about 105 day-and-hour slots, and I only get one new reading of each per week. A prediction has to beat a plain average for that day and hour, and that needs about a month of data.
Hiding numbers after closing
After 22:00 the counter freezes. Showing that number would describe an empty building, and showing 0 would be a number REBOKS never reported, so the bot shows nothing outside opening hours.
16-character bars
Telegram's font is proportional, so the chart has to be in monospace. At 10 characters wide, 15% and 25% looked the same. I also dropped the character for the empty part of the bar, because in some fonts it's a different width from the filled one and it skewed every row.
What the data showed
A zero can mean three different things
Look at the readings at the top of this page: one gym at 99% and the other at exactly 0, at the busiest time of the evening. UTown was closed and reopened the next day, but I only knew because someone told me. The page shows a closed gym, an empty gym and a broken counter the same way, so zeros are saved as reported and never shown as "empty".
The counter freezes at closing
| Sat 19 Sep | UTown | USC |
|---|---|---|
| 21:00 | 65.3 | 40.0 |
| 21:30 | 64.8 | 36.2 |
| 22:00, closing | 61.0 | 31.0 |
| 22:30 | 61.0 | 31.0 |
| 23:00 | 61.0 | 31.0 |
| 23:30 | 61.0 | 31.0 |
Nothing changes for two hours after closing, and both gyms read 0 again at 06:00. Four days of data answered something the page couldn't: the count resets overnight. So I collect from 06:00 to 23:59 but only analyse 07:00 to 22:00. The frozen number is still useful as a rough count of how many people came that day.
It's counting QR scans
People scan in and mostly don't scan out, so the number drifts upward through the day. That's why the bot tells you which gym is quieter. Both are counted the same way, so comparing them is more reliable than either number on its own.
Still open
USC's count goes up and down during the day. UTown's climbs and mostly stays there. If UTown users scan out less, comparing the two by percentage is shakier than it looks, and I don't have enough weeks of data to say yet.
What went wrong
I tested the database layer late
The pure functions had tests from the start. The D1 queries and the webhook didn't, until I added tests that run inside Cloudflare's own runtime, and that untested layer is where a real bug with stale data turned out to be.
Missed readings can't be recovered
NUS sometimes returns an error, and a gap in the history is gone for good. I added an optional alert when collection fails. So it doesn't alert every 5 minutes during an outage, it checks how old the newest saved row is before sending another. Retrying once on failure is still on the to-do list.
What I learned
Most of the design came from the stage where I only looked at the data source. I'd do that first again on anything that depends on someone else's page.
The failures that worry me are the quiet ones. If REBOKS changes its HTML the parser crashes and I find out, but a broken counter reading 0 looks exactly like real data.
I'm also holding off on features until there's data for them. "Best time to go" and predictions can wait until there's a month of readings.
What's next
/best: the quietest time today, once there are four weeks of data./predict: how busy it'll be in 30 to 90 minutes, only if it beats the plain average./alert: a message when a gym drops below a level you pick.